A new mathematical method reads the brain and reveals patterns in brain activity
Research conducted by DTU Compute and Rigshospitalet shows that by using better mathematics, we can begin to see the brain not just as separate parts, but as a dynamic system with shifting patterns. It is another step towards understanding how the brain works – and, in the long term, how to treat it more precisely.
Photo by Shawn Day on Unsplash
Thursday 27 August 2026
Hanne Kokkegård
What if it is not primarily symptoms, but patterns in how the brain operates, that determine how patients with, for example, psychiatric or neurological conditions should best be treated?
DTU Compute and Rigshospitalet have developed a method specifically designed to identify such patterns. The research has just been published in the scientific journal PNAS.
“If a patient, for instance, has a lesion in a specific part of the brain, it is often possible to say quite concretely: this area is not functioning. But for many people with psychiatric disorders or in a coma, the situation is far more complex, and it does not make sense to point to a single area and say that this is where the problem lies. Instead, it is about looking at how brain regions are active at the same time – but perhaps in different ways and in different patterns than in healthy individuals,” explains Anders Stevnhoved Olsen, the lead author of the research, which formed part of his PhD at DTU Compute.
Although the long-term ambition is to improve our understanding of such conditions, the current study focuses exclusively on brain networks in healthy individuals. The research is aimed at developing and validating the method rather than investigating clinical applications or potential treatment improvements.
Mathematics must match the data
Anders Stevnhoved Olsen and Professor Morten Mørup from DTU Compute had previously worked on a similar project on a smaller scale, using simpler models based on scans of healthy individuals. During that work, they realised that it should be possible to develop better models to describe brain signals that rise and fall in rhythmic patterns (oscillating brain signals).
“We saw, many researchers often using methods where the mathematics did not properly match the data. So we started developing a method that more closely matches the underlying geometric structure of oscillating brain signals,” Anders Stevnhoved Olsen says.
Together, he and Morten Mørup developed both the mathematical framework and accompanying Python code capable of analysing data from functional MRI brain scans. The mathematics was drawn from a subfield of statistics called “directional statistics”, which treats data with geometric structure.
The text continues below.
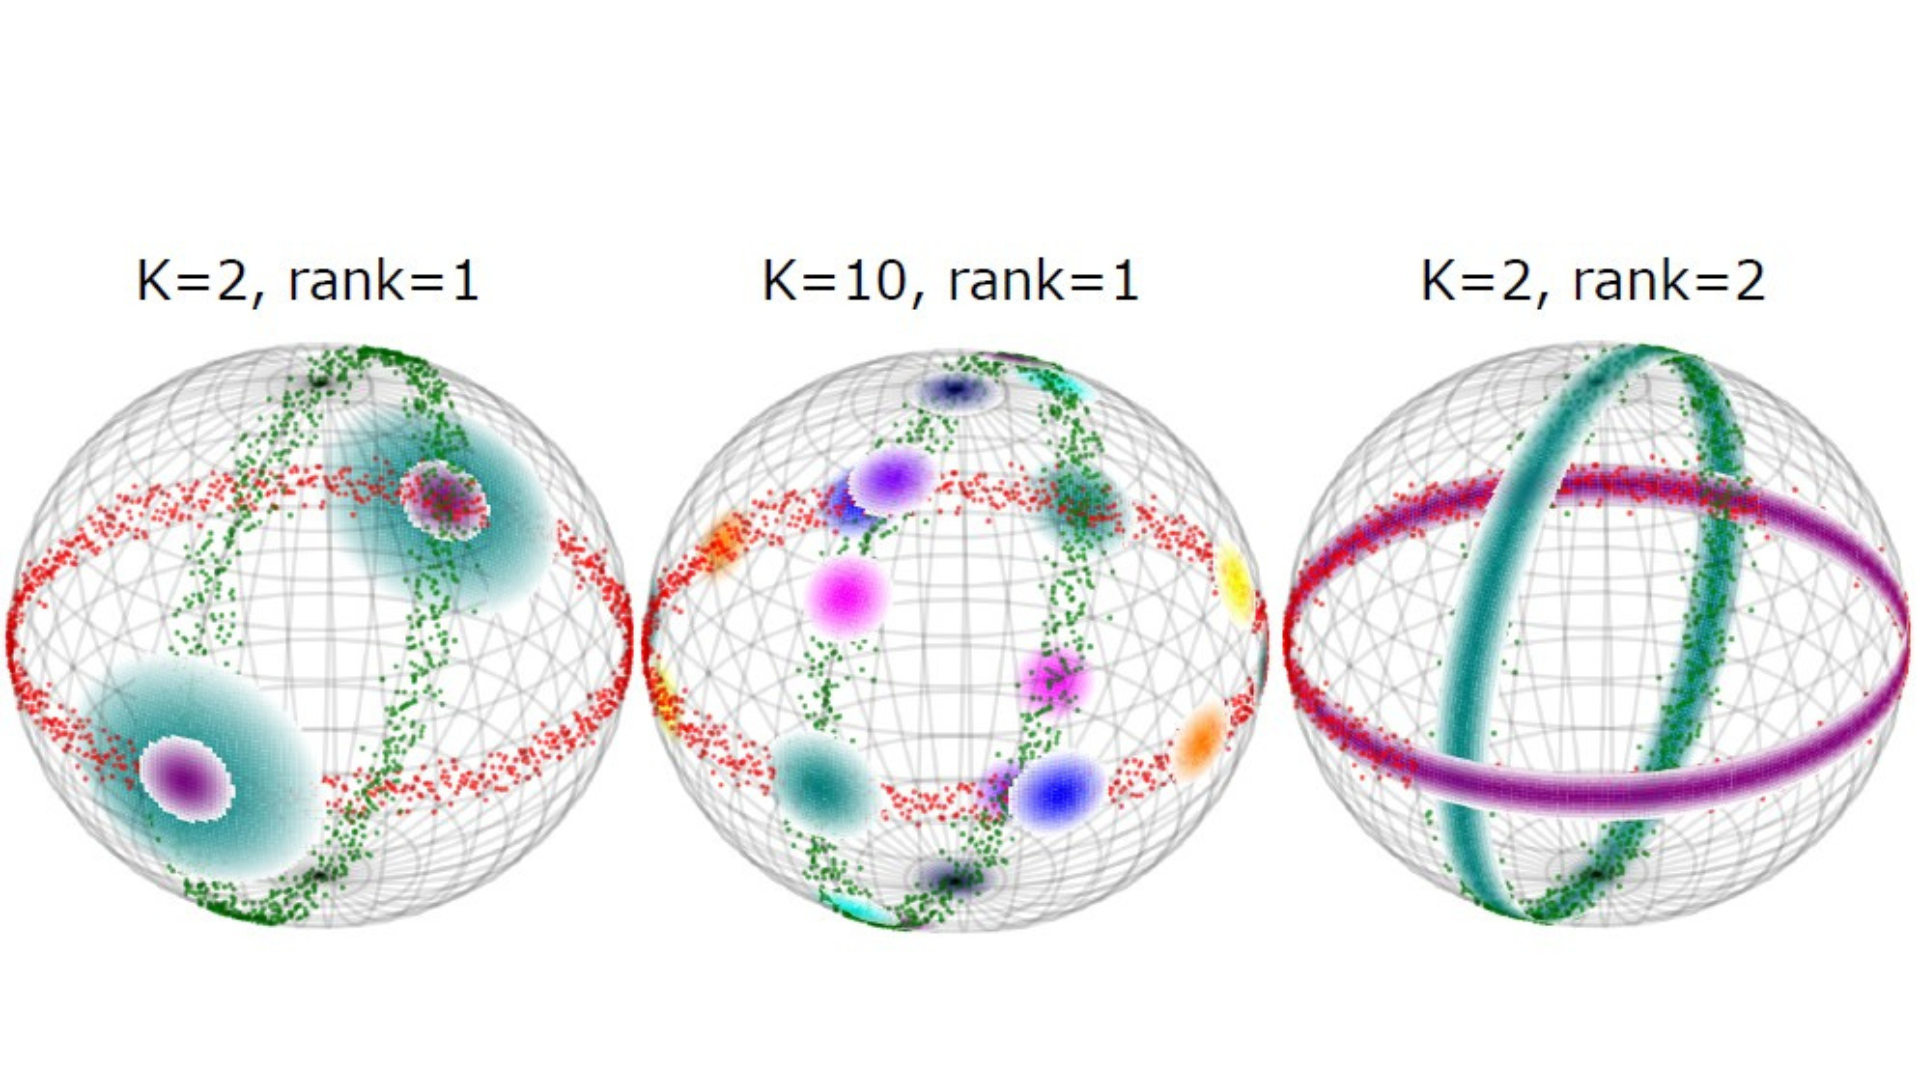
The illustration conveys a key idea: that data are not just random points, but have a particular shape or structure. Here, this structure is shown as spheres. The small dots in the background represent the data. The green and red points show two different states that the brain switches between. First, the brain is in the green state for a period of time, after which it shifts to the red state. Each state corresponds to a specific pattern in brain activity. This is illustrated by the different orientations: the green structure is more vertical, while the red is more horizontal. This shows that the two states are distinct. To describe the data correctly, the model must have the right level of complexity. If the model is too simple, it cannot distinguish between the states. If it is too complex, it risks describing random variation rather than meaningful patterns. The goal is therefore to find the right balance, so that the model fits the data. When achieved, the result is a model that both explains the data well and remains interpretable. Credit: Anders Stevnshoved Olsen, DTU/Rigshospitalet
Data from brain scans during tasks
The researchers did not perform the scans themselves. Instead they analysed data from a publicly available dataset in which healthy participants completed seven different tasks and data from so-called resting-state to compare the results of using the methods.
The functional brain scans data is made by scanner continuously takes images of the brain and measures small changes in blood flow, which reflect brain activity. By linking the timing of tasks to these measurements, it becomes possible to see which areas of the brain are active – and how they work together over time.
A key element of the new method is that it moves away from focusing solely on the amplitude of brain signals – that is, the strength of their waveforms. These are highly sensitive to noise, for example if the patient moves during the scan, and can therefore be misleading and not reflect the actual neural signals in the brain.
Instead, the method analyses how signals oscillate together (phase coherence). This provides a more robust picture of how different brain regions interact.
The method is based on a statistical model (a mixture model) of such phase coherence time-series, which describes the brain as continuously switching between different ‘states’ of activity. These states can be identified automatically from the data – without prior knowledge of what the person is doing.
“By modelling the evolution of these oscillations as movement between a mixture of different ‘states’, we have shown that our method is better at detecting when a person is performing a given task in the scanner, and at distinguishing between different tasks than traditional methods,” says Anders Stevnhoved Olsen.
The text continues below.
Facts
About the research
The dataset
Brain scans can be acquired while participants are at rest, a so-called resting-state condition. In this study, however, the participants carried out a variety of tasks during the scans.
The study uses data from the Human Connectome Project, which includes seven standardised tasks:
Emotion processing
Gambling
Language
Motor (movement)
Relational processing
Social cognition
Working memory
A contribution to personalised medicine
As previously mentioned, the research here focused on methods for mapping how the brain works. This knowledge holds significant potential.
By uncovering how different parts of the brain interact, the method suggests that, in the future, there may be less need to rely on traditional diagnostic categories.
“In the long term, this kind of knowledge could contribute to personalised medicine. For example, if a brain scan shows that a patient’s brain network differs from the typical pattern in a specific way, it may be possible to assign that patient to a group where a particular treatment is more effective,” says Anders Stevnhoved Olsen.
Psychiatric conditions are often difficult to divide into clear categories, and current diagnoses – such as depression, anxiety or stress – are, in many cases, relatively broad classifications.
“It may turn out that the brain changes in patterns that cut across established diagnoses, and which can only be detected using more precise analyses,” he says.
Today, Anders Stevnhoved Olsen works at postdoc at Rigshospitalet on research into consciousness, including studies of patients in a coma:
“In this context, it is highly relevant to be able to describe how brain function differs from that of healthy individuals. That is also something we hope the method can be used for.”
Rather than measuring signal strength, the method analyses how signals oscillate together (phase coherence). This provides a more robust picture of how different brain regions interact.
The method is based on a statistical model (a mixture model) that describes the brain as continuously switching between different ‘states’ of activity. These states can be identified automatically from the data – without prior knowledge of the task being performed.